Grafana Alloy
Grafana Alloy combines the strengths of the leading collectors into one place. Whether observing applications, infrastructure, or both, Grafana Alloy can collect, process, and export telemetry signals to scale and future-proof your observability approach.
Currently, this add-on supports the following components:
- prometheus.scrape - Sends metrics to Prometheus write endpoint.
- prometheus.exporter.unix - Uses the node_exporter to expose Home Assistant Hardware and OS metrics for *nix-based systems.
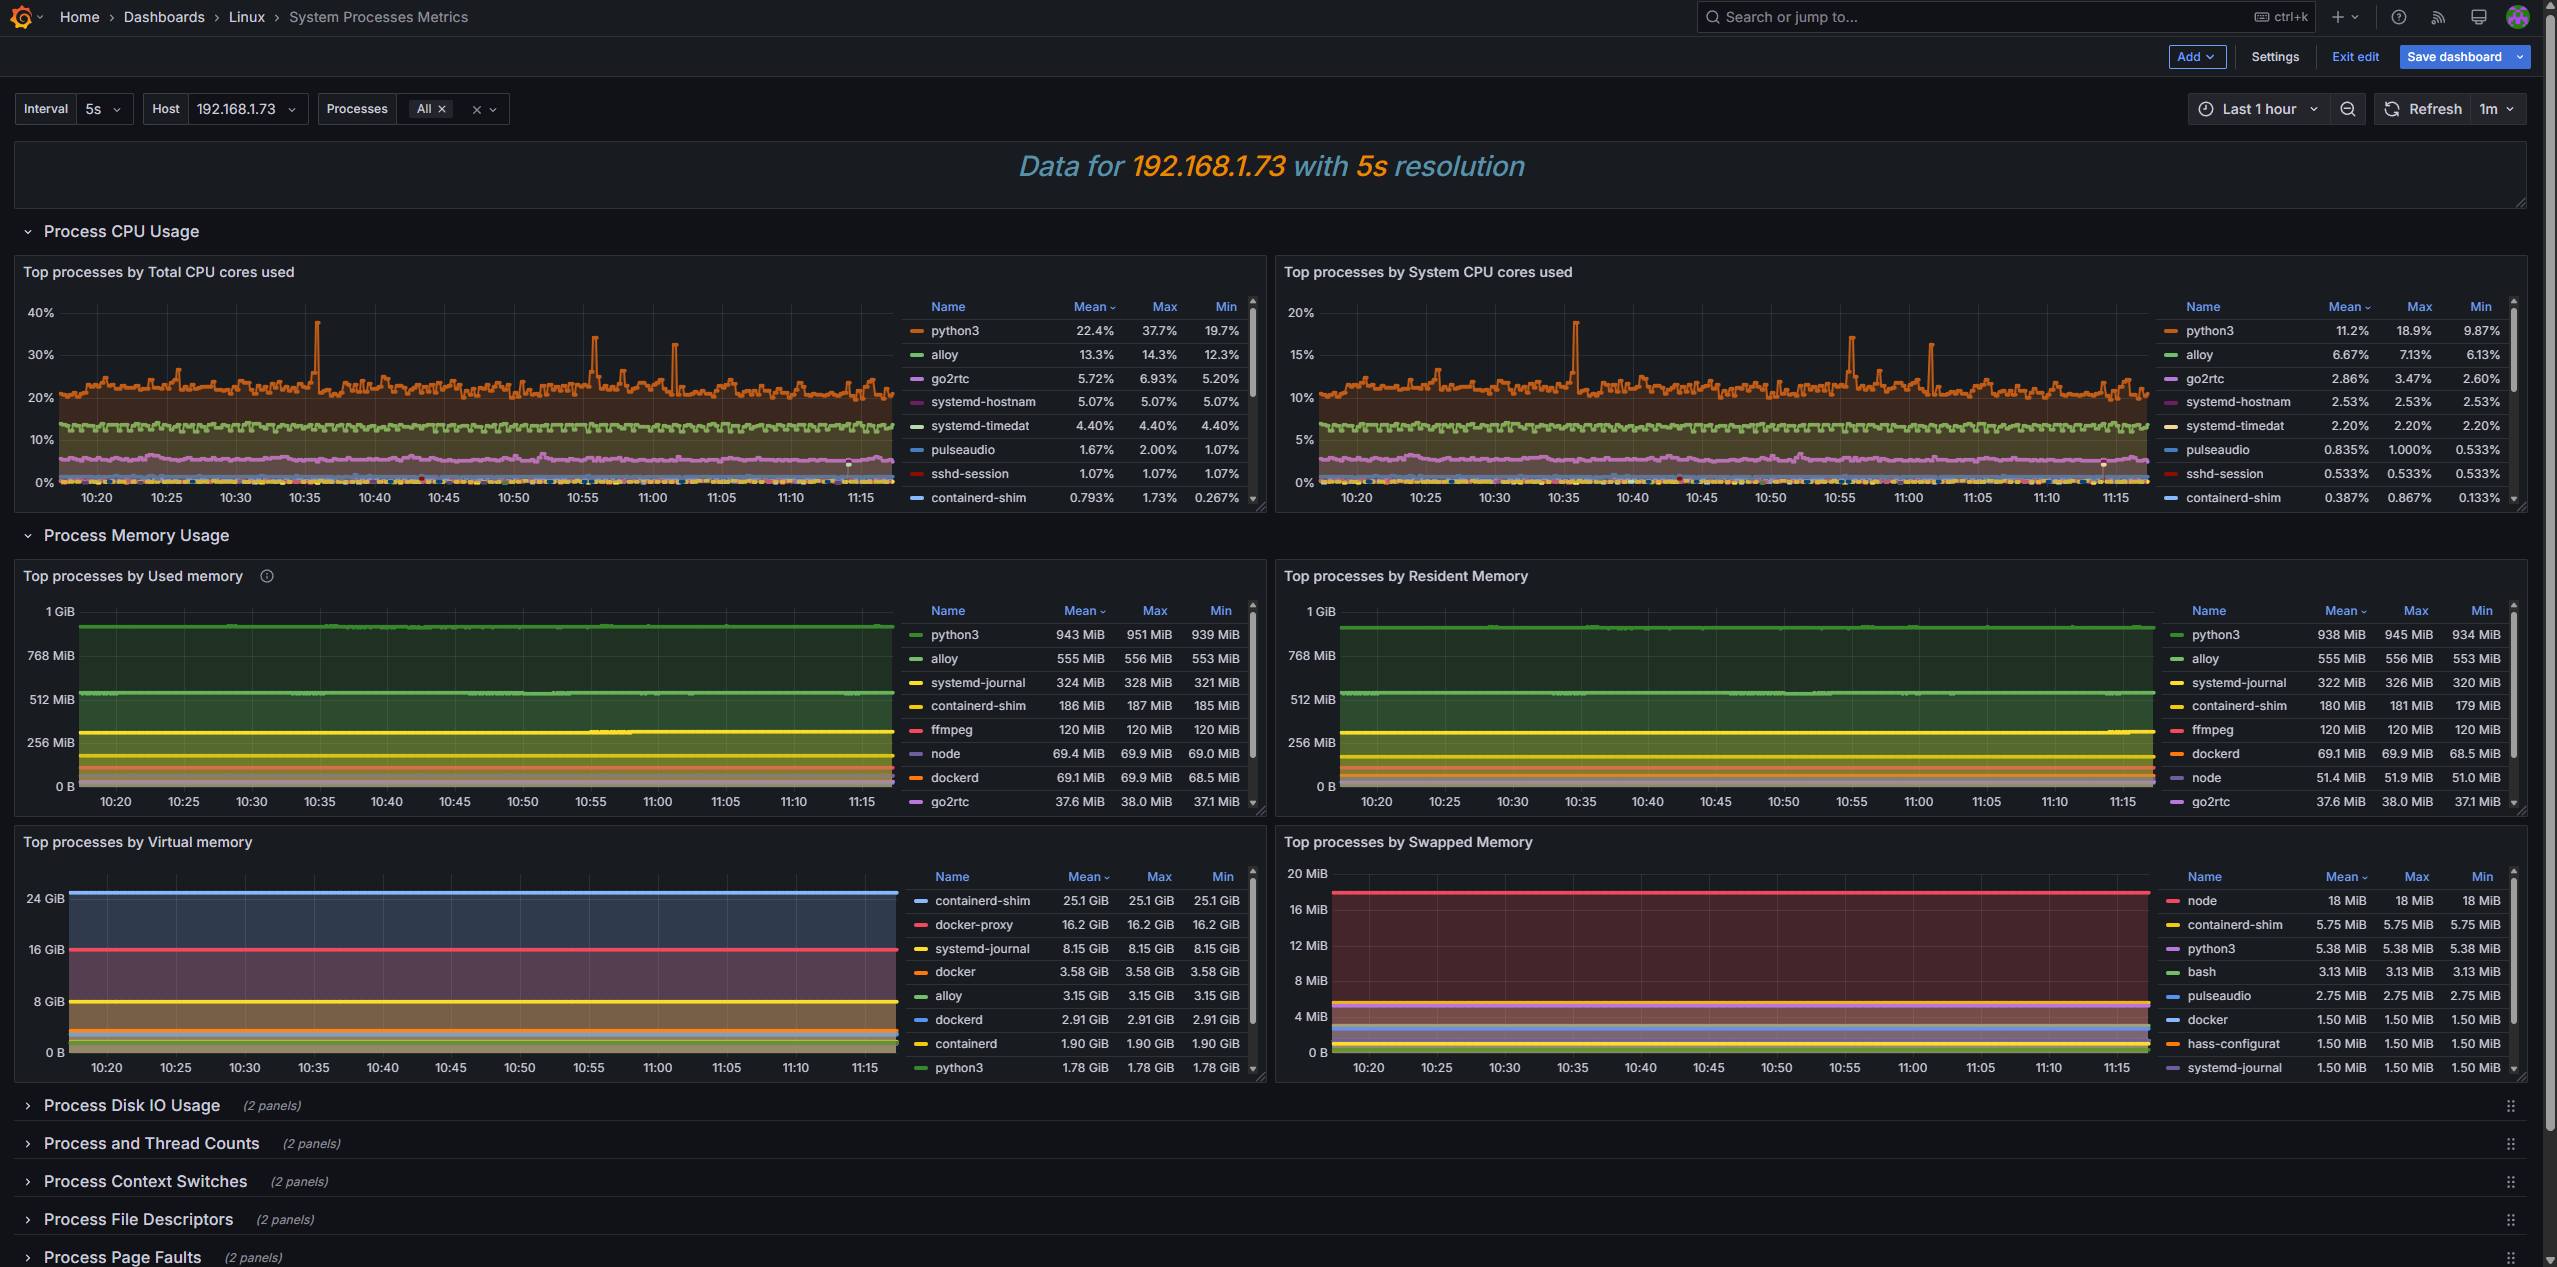
- prometheus.exporter.process - Enables process_exporter to collect Home Assistant process stats from /proc.
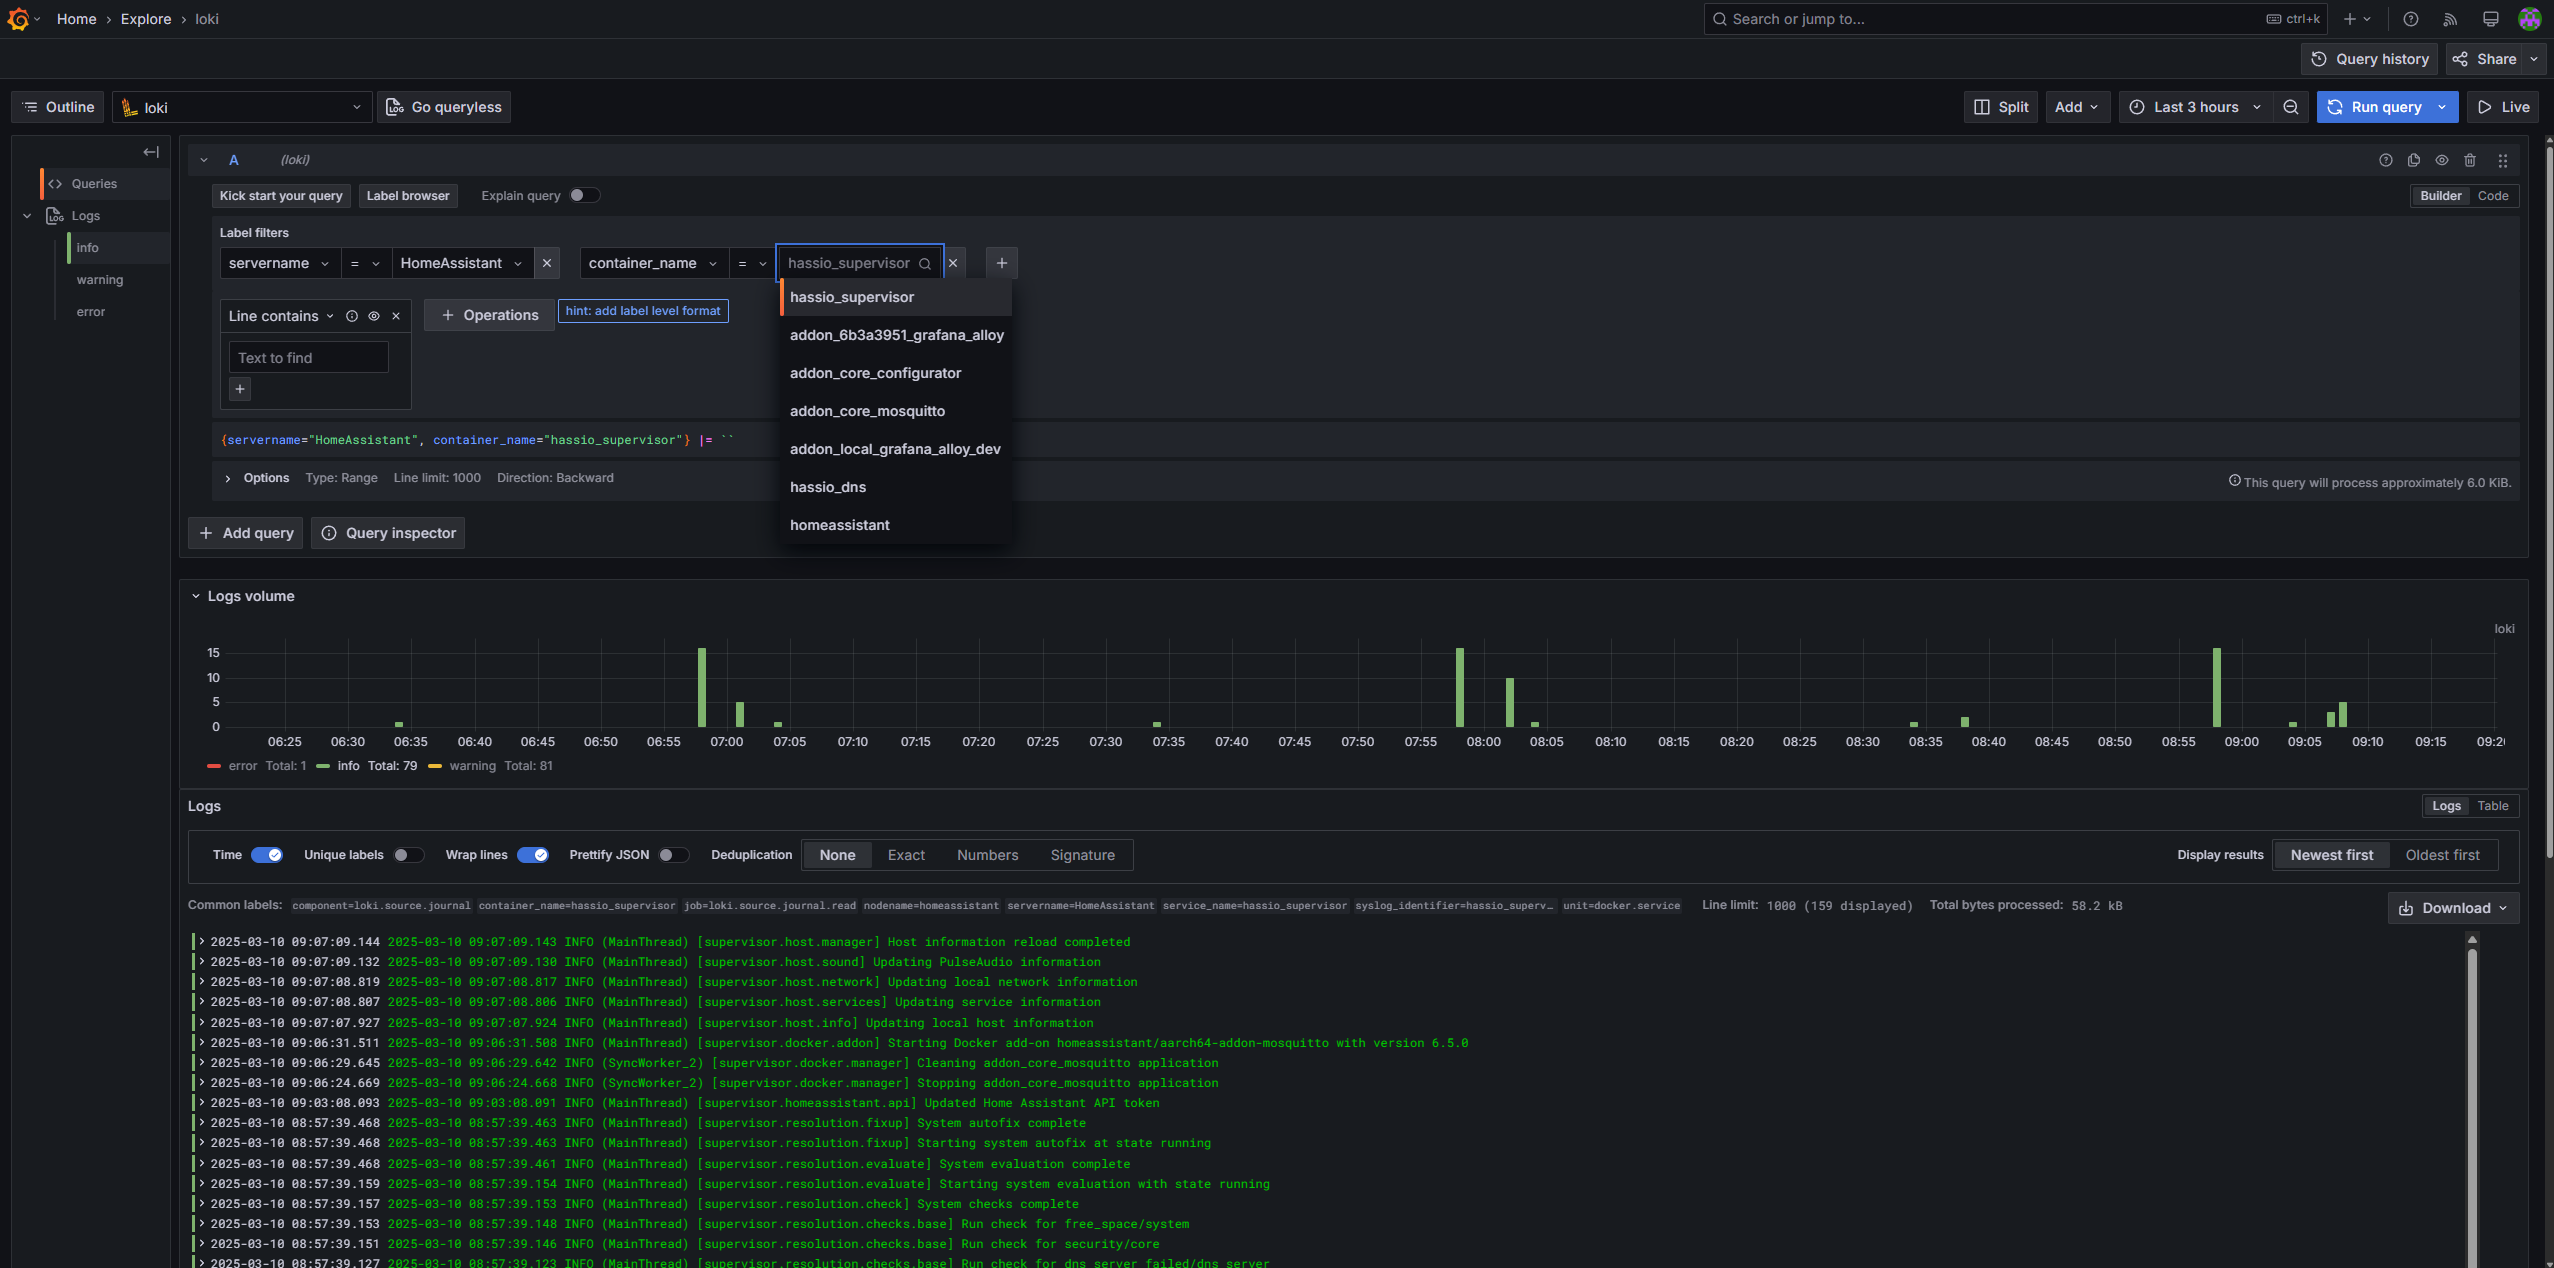
- loki.write - Sends logs to Loki instance.
- loki.source.journal - Collects Home Assistant Journal logs to send to Loki.
Installation
- Add repository to Home Assistant.
- Search for "Grafana Alloy" in the Home Assistant add-on store and install it.
- Disable "Protection mode" in the add-on panel. (Optional, see below for more details)
- Update configuration on the add-on "Configuration" Tab. See options below.
- Start the add-on.
- Check the
Logsto confirm the add-on started successfully. - You can also visit the Grafana Alloy Web UI by visiting
http://<homeassistnat_ip>:12345in your browser.
Protection Mode
Disabling protection mode is optional, however there are a few things that I found don't work without disabling it. Most the limitations are around host processes. Per the Home Assistant Docs: "Allow the container to run on the host PID namespace. Works only for not protected add-ons."
Note: These are just the limitations I found, there may be other incorrect or missing metrics.
Only disable the protection mode if you know, need AND trust the source of this add-on. Always review the code of an add-on before disabling protection mode.
Limitations:
prometheus.exporter.process
- If Protection mode is enabled, the only process that will be collected is the one for Alloy. There will be no metrics for host processes.
prometheus.exporter.unix
- Process related metrics won't display any host process information with protection mode enabled.
- Disk metrics will only show mount data for the Alloy add-on, no host mount data will be collected with protection mode enabled.
loki.source.journal
No limitations that I found.
Configuration
| Config | Description | Default value | Required |
|---|---|---|---|
enable_prometheus |
Enable sending metrics to Prometheus. If enabled, prometheus_write_endpoint is required. | true | No |
prometheus_write_endpoint |
Full URL to send metrics to. | http://prometheus:9090/api/v1/write | If enable_prometheus=true |
enable_unix_component |
Enables prometheus.exporter.unix component to collect node_exporter metrics. | true | No |
enable_process_component |
Enables prometheus.exporter.process component to collect process_exporter metrics. | true | No |
prometheus_scrape_interval |
How frequently to scrape the targets of this scrape configuration. | No | |
servername_tag |
servername tag value value. | HomeAssistant | No |
instance_tag |
Overwrite the default metric "instance" tag. | No | |
enable_loki |
Enable sending logs to Loki. If enabled, loki_endpoint is required. | false | No |
loki_endpoint |
Full Loki URL to send logs to. | http://loki:3100/api/v1/push | No |
enable_loki_syslog |
Listen for syslog messages over UDP or TCP connections and forwards them to loki. | false | No |
override_config |
If enabled, all other options will be ignored and you can supply your own Alloy config. | false | No |
override_config_path |
Path to Override Alloy config file. HA config directory is counted to /config. | /config/alloy/example.alloy | If override_config=true |
If override_config is true and a valid Alloy config file is supplied in override_config_path, all other options will be ignored.
Support
- Tested on
aarch64andamd64.
Todo
- Add more customization options (Enable/disable components, scrape_interval, etc..)
- Add Github workflows
- Build and publish a docker image so users don't have to build the image on every install
- Verify all permissions added to
config.yamlare required and remove unneeded ones
Example Data
https://grafana.com/grafana/dashboards/1860-node-exporter-full/

https://grafana.com/grafana/dashboards/8378-system-processes-metrics/

